
What Are the Top IoT Devices for Energy Monitoring in 2026?
Energy costs can shift quickly, while a monthly bill often hides when and where electricity is being used. Iot Devices For Energy Monitoring make that activity easier to see, from a refrigerator cycling overnight to a heater running during peak hours. In 2026, useful options range from smart plugs and whole-home monitors to circuit-level meters and building energy gateways. Each measures energy differently.
The right choice depends on the site. A renter may need a plug-in monitor that takes minutes to install. A homeowner with solar panels may value whole-home data, export tracking, and clear app alerts. A small facility may need submetering, multiple-user access, and integration with its existing management system. Simple details matter: measurement accuracy, update frequency, installation requirements, data storage, and ongoing fees. A polished dashboard is not enough.
This guide compares leading device types and notable 2026 options using practical criteria, rather than treating every product as interchangeable. It also considers compatibility, security updates, and whether the readings help users make informed changes. Not every site needs granular data. Sometimes, one circuit tells the story; sometimes, it does not. Product specifications can change, and advertised accuracy may depend on installation and electrical conditions. That deserves a closer look. Readers should verify current specifications and local compatibility before buying, especially when professional installation may be required. The goal is a clear shortlist, not a universal winner.
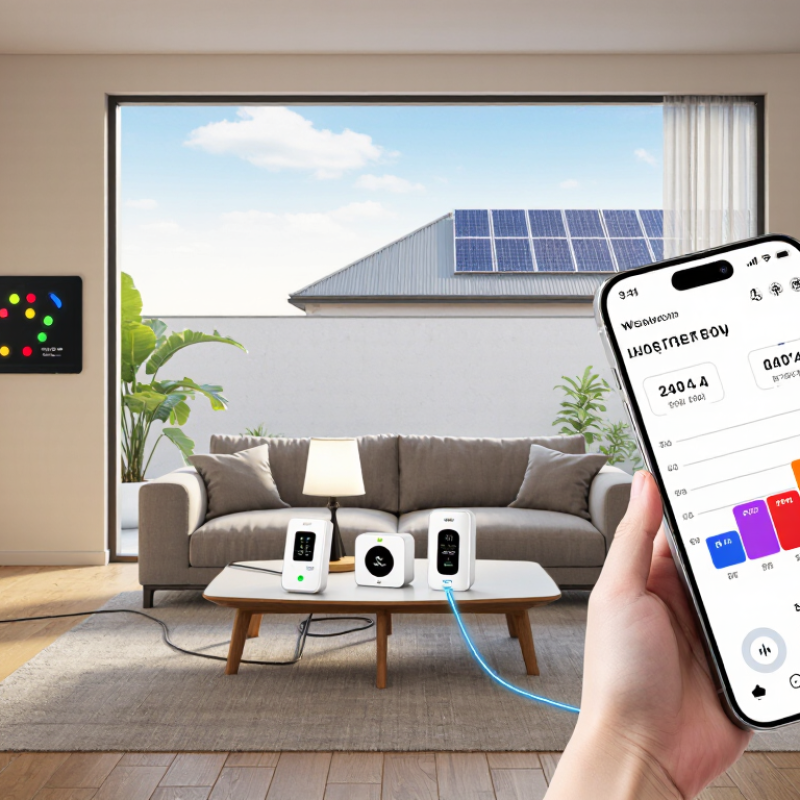
Energy-Monitoring IoT: The IEA’s 30% Buildings-Energy Baseline
The IEA’s estimate that buildings use about 30% of global final energy gives energy monitoring real weight. It is a baseline, not a promise that every building can save the same amount. Heating, cooling, lighting, and equipment use vary with weather, occupancy, and operating hours. A useful IoT setup makes those patterns visible.
Smart electricity meters show whole-building demand, while circuit-level monitors help locate heavy loads. Temperature and humidity sensors add context: a heating system running hard in an empty room tells a different story from one serving a busy space. Motion or occupancy sensors can help explain those changes. Small details matter. A poorly placed sensor can distort the picture.
For 2026, look for devices that record readings at regular intervals, retain data during network outages, and export it in a usable format. Secure access and clear calibration records matter too. Compare readings with utility bills before acting; one dashboard is not proof of savings. The data can still mislead. Occupancy estimates may be off, and unusual weather can skew comparisons. That’s an imperfect part of the process. Monitoring helps teams ask sharper questions, but people still need to check what the numbers mean.
What Are the Top IoT Devices for Energy Monitoring in 2026? — Energy-Monitoring IoT: The IEA’s 30% Buildings-Energy Baseline
The International Energy Agency (IEA) estimates that buildings account for around 30% of global final energy consumption. The device types below help measure building energy use and identify opportunities to improve efficiency; actual savings depend on the building, equipment, controls, and operating practices.
| IoT Device Type | What It Measures | Typical Monitoring Output | Best-Fit Use | Installation Notes | Key Limitation |
|---|---|---|---|---|---|
| Smart electricity meter | Whole-building electricity consumption; some models also record demand and voltage. | Time-stamped energy readings, commonly reported in kWh, and, where supported, demand in kW. | Establishing a building-wide baseline and comparing consumption over time. | Check meter communications, utility data access, and measurement interval before deployment. | A whole-building reading does not identify which end use is responsible for consumption. |
| Circuit-level submeter | Electricity on selected distribution circuits, such as lighting, kitchen equipment, or HVAC panels. | Circuit-level kWh and, depending on the device, power and current readings. | Finding high-use systems and verifying the effect of operational changes. | Current transformers must be correctly matched to the circuit and installed in an electrical enclosure by qualified personnel. | Monitoring only covers the circuits that have been instrumented. |
| Plug-load energy monitor | Electricity used by an individual plug-connected appliance or device. | Device-level energy and power readings, when supported by the monitor. | Offices, small equipment, and identifying loads that remain on outside operating hours. | Confirm voltage, current, plug type, and electrical rating are suitable for the connected load. | Does not measure hard-wired equipment or loads connected through unmonitored outlets. |
| HVAC equipment energy meter | Electricity used by heating, ventilation, and air-conditioning equipment or its dedicated circuit. | Energy and power data that can be compared with operating schedules and indoor conditions. | Assessing HVAC schedules, after-hours operation, and energy use relative to building occupancy. | Pair electrical measurements with relevant equipment status or temperature data for better interpretation. | Energy readings alone do not show whether comfort or ventilation requirements are being met. |
| Temperature and humidity sensor | Indoor air temperature and relative humidity; some deployments also measure outdoor conditions. | Time-stamped environmental readings for comparison with HVAC energy and setpoints. | Checking comfort conditions and identifying potential heating or cooling schedule issues. | Locate sensors away from direct sunlight, supply-air outlets, and other sources of measurement bias. | These sensors do not measure energy use directly. |
| Occupancy or presence sensor | Presence or movement in a defined area, depending on sensor technology and configuration. | Occupancy events or room-use patterns that can be compared with lighting and HVAC schedules. | Supporting demand-based control and checking whether energy use matches space use. | Coverage and detection behavior vary by sensor type, mounting position, and room layout. | Occupancy data is indirect evidence of energy use and should be interpreted with meter readings. |
| Power-quality meter | Electrical quantities such as voltage, current, frequency, and power factor; supported measurements vary by model. | Electrical-use and supply-condition data for diagnosing selected power or equipment issues. | Facilities with sensitive equipment or a need to investigate electrical operating conditions. | Confirm measurement scope, phase configuration, and installation requirements with a qualified electrician. | Advanced electrical measurements may require specialist interpretation and are not necessary for every building. |
| IoT data gateway | Collects readings from connected meters and sensors; it is not usually an energy meter itself. | Data transfer, protocol translation, and, on some systems, local buffering during network interruptions. | Connecting devices that use different communication protocols to a central monitoring platform. | Check protocol compatibility, network coverage, cybersecurity controls, and data-retention behavior. | A gateway cannot provide reliable measurements if connected sensors are missing, misconfigured, or inaccurate. |
Source note: IEA, “Buildings” sector tracking, for the approximate 30% global final-energy-consumption baseline. Device capabilities and measurement availability vary by model and installation; verify specifications and local electrical requirements before deployment.